Introduction
This section guides Drought Watch end-users on how to utilize functionalities within the system. The system contains drought-relevant information such as maps of indicators derived from different data sources. It provides various tools like analytical graphs and interactive layer interaction allowing for display and analysis this drought information and drought reports give an overview of the situation in case of imminent droughts.
Visit the system at https://droughtwatch.icpac.net
It comprises of:
A web-GIS environment:
Weather and Earth Observation (EO) indicators
Automatic warnings regarding developing or actual drought events every 10 days
Additional indicators showing recovery process after drought events
A statistics dashboard:
Indicators statistics aggregated at sub-national level(s)
Additional information such as periodic reports
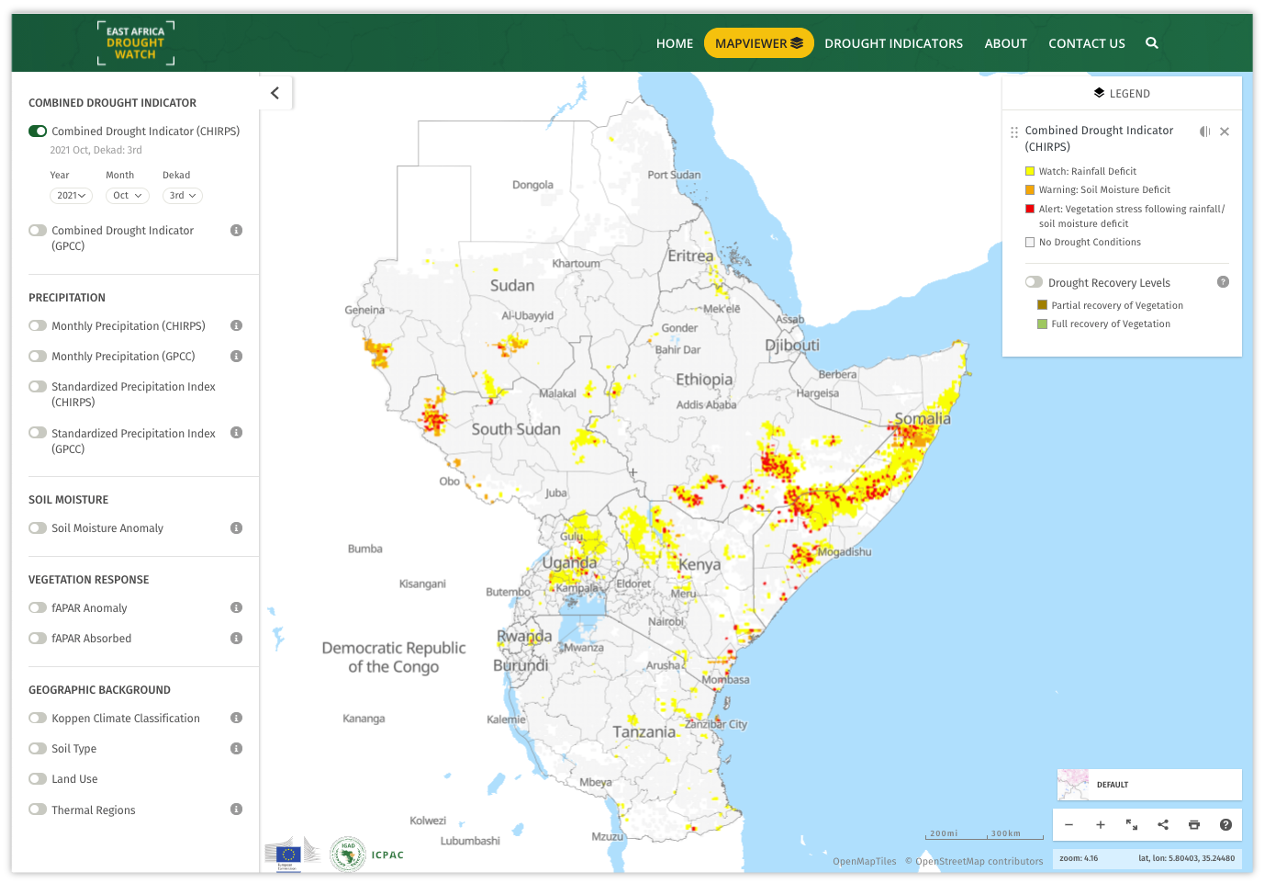
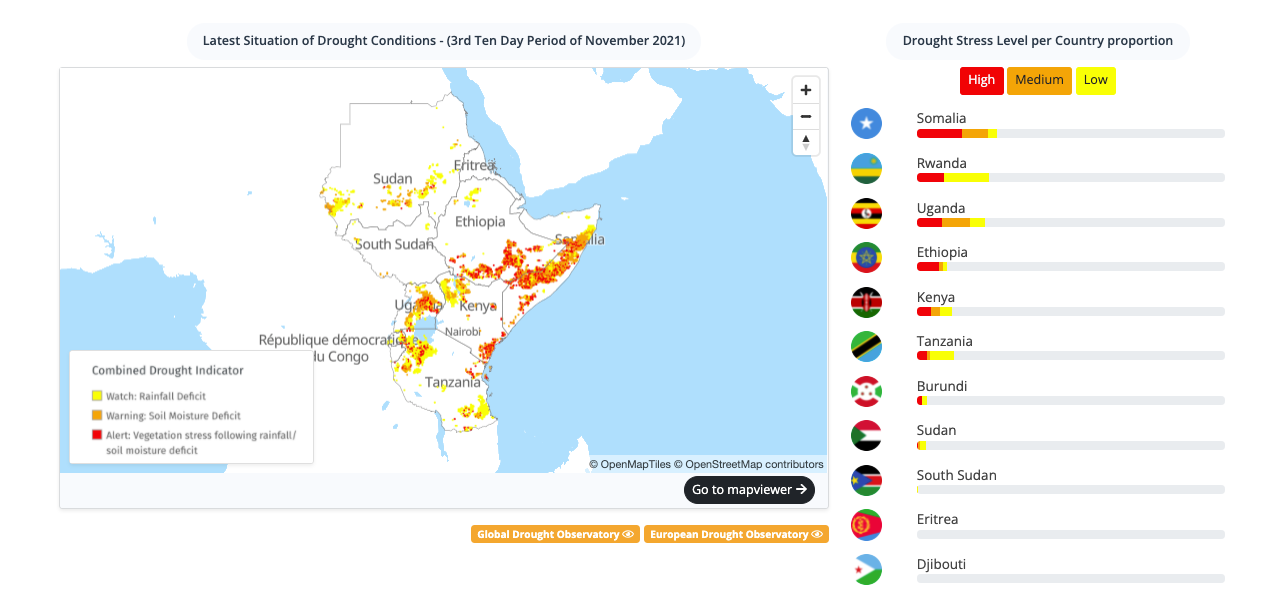
On the landing page of the system (https://droughtwatch.icpac.net), the latest situation of drought based on the Combined Drought Indicator is displayed. This Indicator is based on SPI, Soil moisture and fAPAR, to identify areas with potential to suffer agricultural drought, areas where the vegetation is already affected by drought conditions, and areas in recovery process to normal conditions after a drought episode. More details
Within the user guide, you will be able to undestand how to:
Interact with the mapviewer
Generate drought-relevant reports
Give feedback/questions relating to the System