Combined Drought indicator (CDI)
Introduction
The meteorological, hydrological and satellite-derived biophysical upon which the CDI indicator produced by EADW is based, as well as the indicator’s temporal and spatial scales and geographic coverage, are summarised below.
Variable |
|
Temporal Scale |
10 days (= 1 dekad) |
Spatial Scale |
0.1 Decimal Degrees/10 km |
Coverage |
Greater Horn of Africa |
Overview
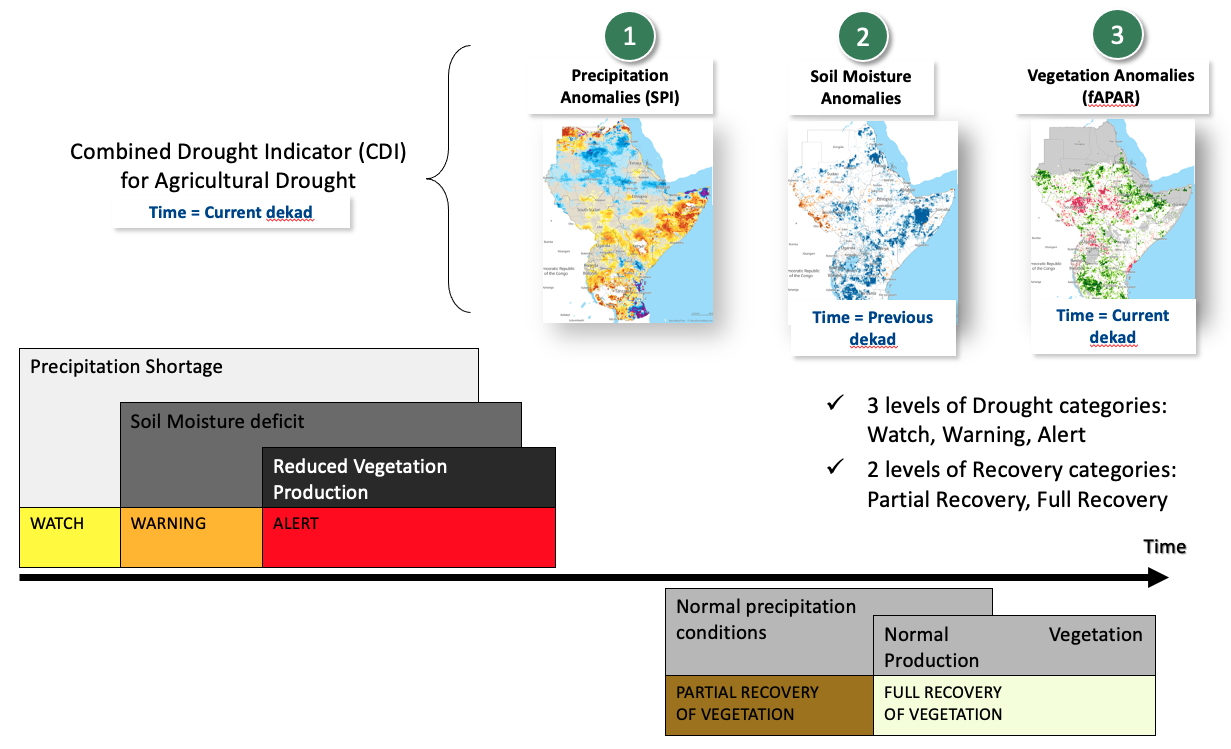
Combined Drought Indicator based on SPI (from CHIRPS), soil moisture and fAPAR, to identify areas with potential to suffer agricultural drought, areas where the vegetation is already affected by drought conditions, and areas in recovery process to normal conditions after a drought episode. The method is based in 5 impact levels.
These levels are:
‘Watch’ when a relevant precipitation shortage is observed,
‘Warning’ when this precipitation shortage comes with a soil moisture anomaly,
‘Alert’ when these two conditions are accompanied with an anomaly in the vegetation condition,
‘Partial recovery’ when after a drought episode, the meteorological conditions are recovered to normal but not the vegetation conditions,
‘Full recovery’ when meteorological and vegetation normal conditions are recovered.
What the indicator shows
Agricultural drought, which is one of the three main types of drought (the others being meteorological and hydrological droughts) that are defined according to the affected variables of the hydrological cycle, is characterized by a reduced crop production due to insufficient soil moisture.
The Combined Drought Indicator (CDI) identifies areas with the potential to suffer agricultural drought, areas where the vegetation is already affected by drought conditions, and areas in the process of recovery to normal conditions after a drought episode. The CDI is based on the cause-effect relationship for agricultural drought, whereby a shortage of precipitation leads to a soil moisture deficit, which in turn results in a reduction of vegetation productivity. The indicator is computed by combining anomalies of precipitation, soil moisture and satellite-measured plant growth - as measured by, respectively, indicators Standardized Precipitation Index, Soil Moisture Anomaly, and FAPAR Anomaly – using a classification scheme consisting of five drought levels (corresponding to the different stages of the cause-effect relationship for agricultural drought).
How the indicator is computed
The Combined Drought Indicator (CDI) is derived by integrating the following three main drought indicators, which are implemented operationally within the system:
Standardized Precipitation Index (SPI): The SPI indicator measures precipitation anomalies at a given location, based on a comparison of observed total precipitation amounts for an accumulation period of interest (e.g. 1, 3, 12, 48 months), with the long-term historic rainfall record for that period (McKee et al., 1993; Edwards and McKee, 1997).
Soil Moisture Anomaly (SMA): The SMA indicator is derived from anomalies of estimated daily soil moisture (or soil water) content - represented as standardized soil moisture index (SMI) - which is produced by the JRC’s LISFLOOD hydrological model (de Roo et al. 2000), and which has been shown to be effective for drought detection purposes (Laguardia and Niemeyer, 2008).
FAPAR Anomaly: The FAPAR Anomaly indicator is computed as deviations of the biophysical variable Fraction of Absorbed Photosynthetically Active Radiation (FAPAR), composited for 10- day intervals, from long-term mean values. Satellite-measured FAPAR represents the fraction of incident solar radiation that is absorbed by land vegetation for photosynthesis, and is effective for detecting and assessing drought impacts on vegetation canopies (Gobron et al., 2005).
The one-month, three-month, nine-month and twelve-month Standardized Precipitation Index (SPI-1 and SPI-3) are used for computing the CDI. Several studies (e.g. Ji and Peter, 2003; Rossi and Niemeyer, 2012) have shown that SPI-3 has the strongest correlation with the vegetation response, and is therefore the most suitable for identifying agricultural drought, whereas SPI-1 can detect extreme short-term dryness that can dramatically affect the vegetation condition depending on its stage of development.
For SPI-3, SPI-9, SPI-12, FAPAR Anomaly and Soil Moisture Anomaly (SMA) indicators, a threshold of minus one (-1) standard deviation is used, which equates to a return period of 6.3 years, and corresponds to “moderate drought”, according to the SPI classification of McKee et al. (1993). In the case of SPI-1, a threshold of minus two (-2) standard deviations is used, corresponding only to cases identified as extreme drought. The classification scheme that is used to assign areas to one of the five drought classes is summarised BELOW as well as the colour scheme used for depiction in the CDI maps
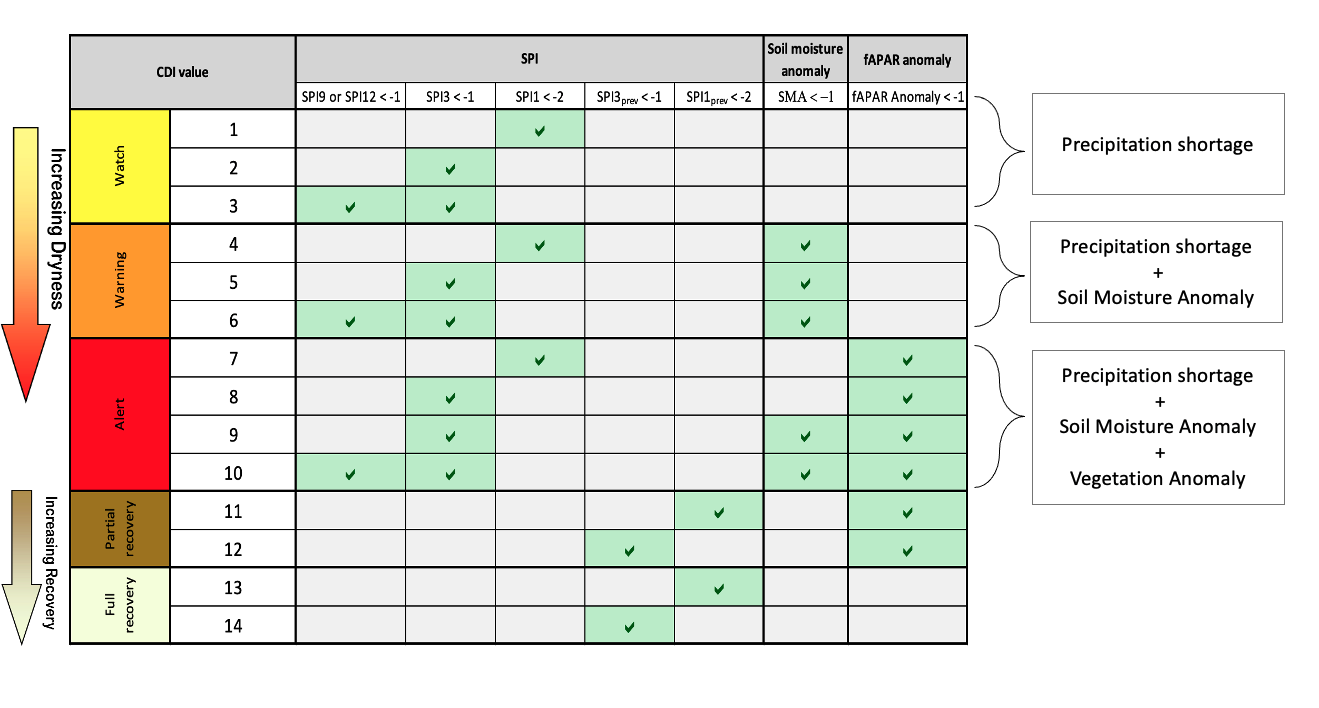
In applying the classification scheme, a temporal lag between the three components of the CDI is implemented. Thus, SPI of a given month is contrasted with soil moisture anomalies of the 2nd and 3rd dekads of that month, and with the 1st dekad of the following month, and with FAPAR anomalies of the 3rd dekad of that month and the 1st and 2nd dekads of the following month. Each month is assumed to have three dekads (days 1-10; days 11-20; day 21 to the end of the month)
How to use the indicator
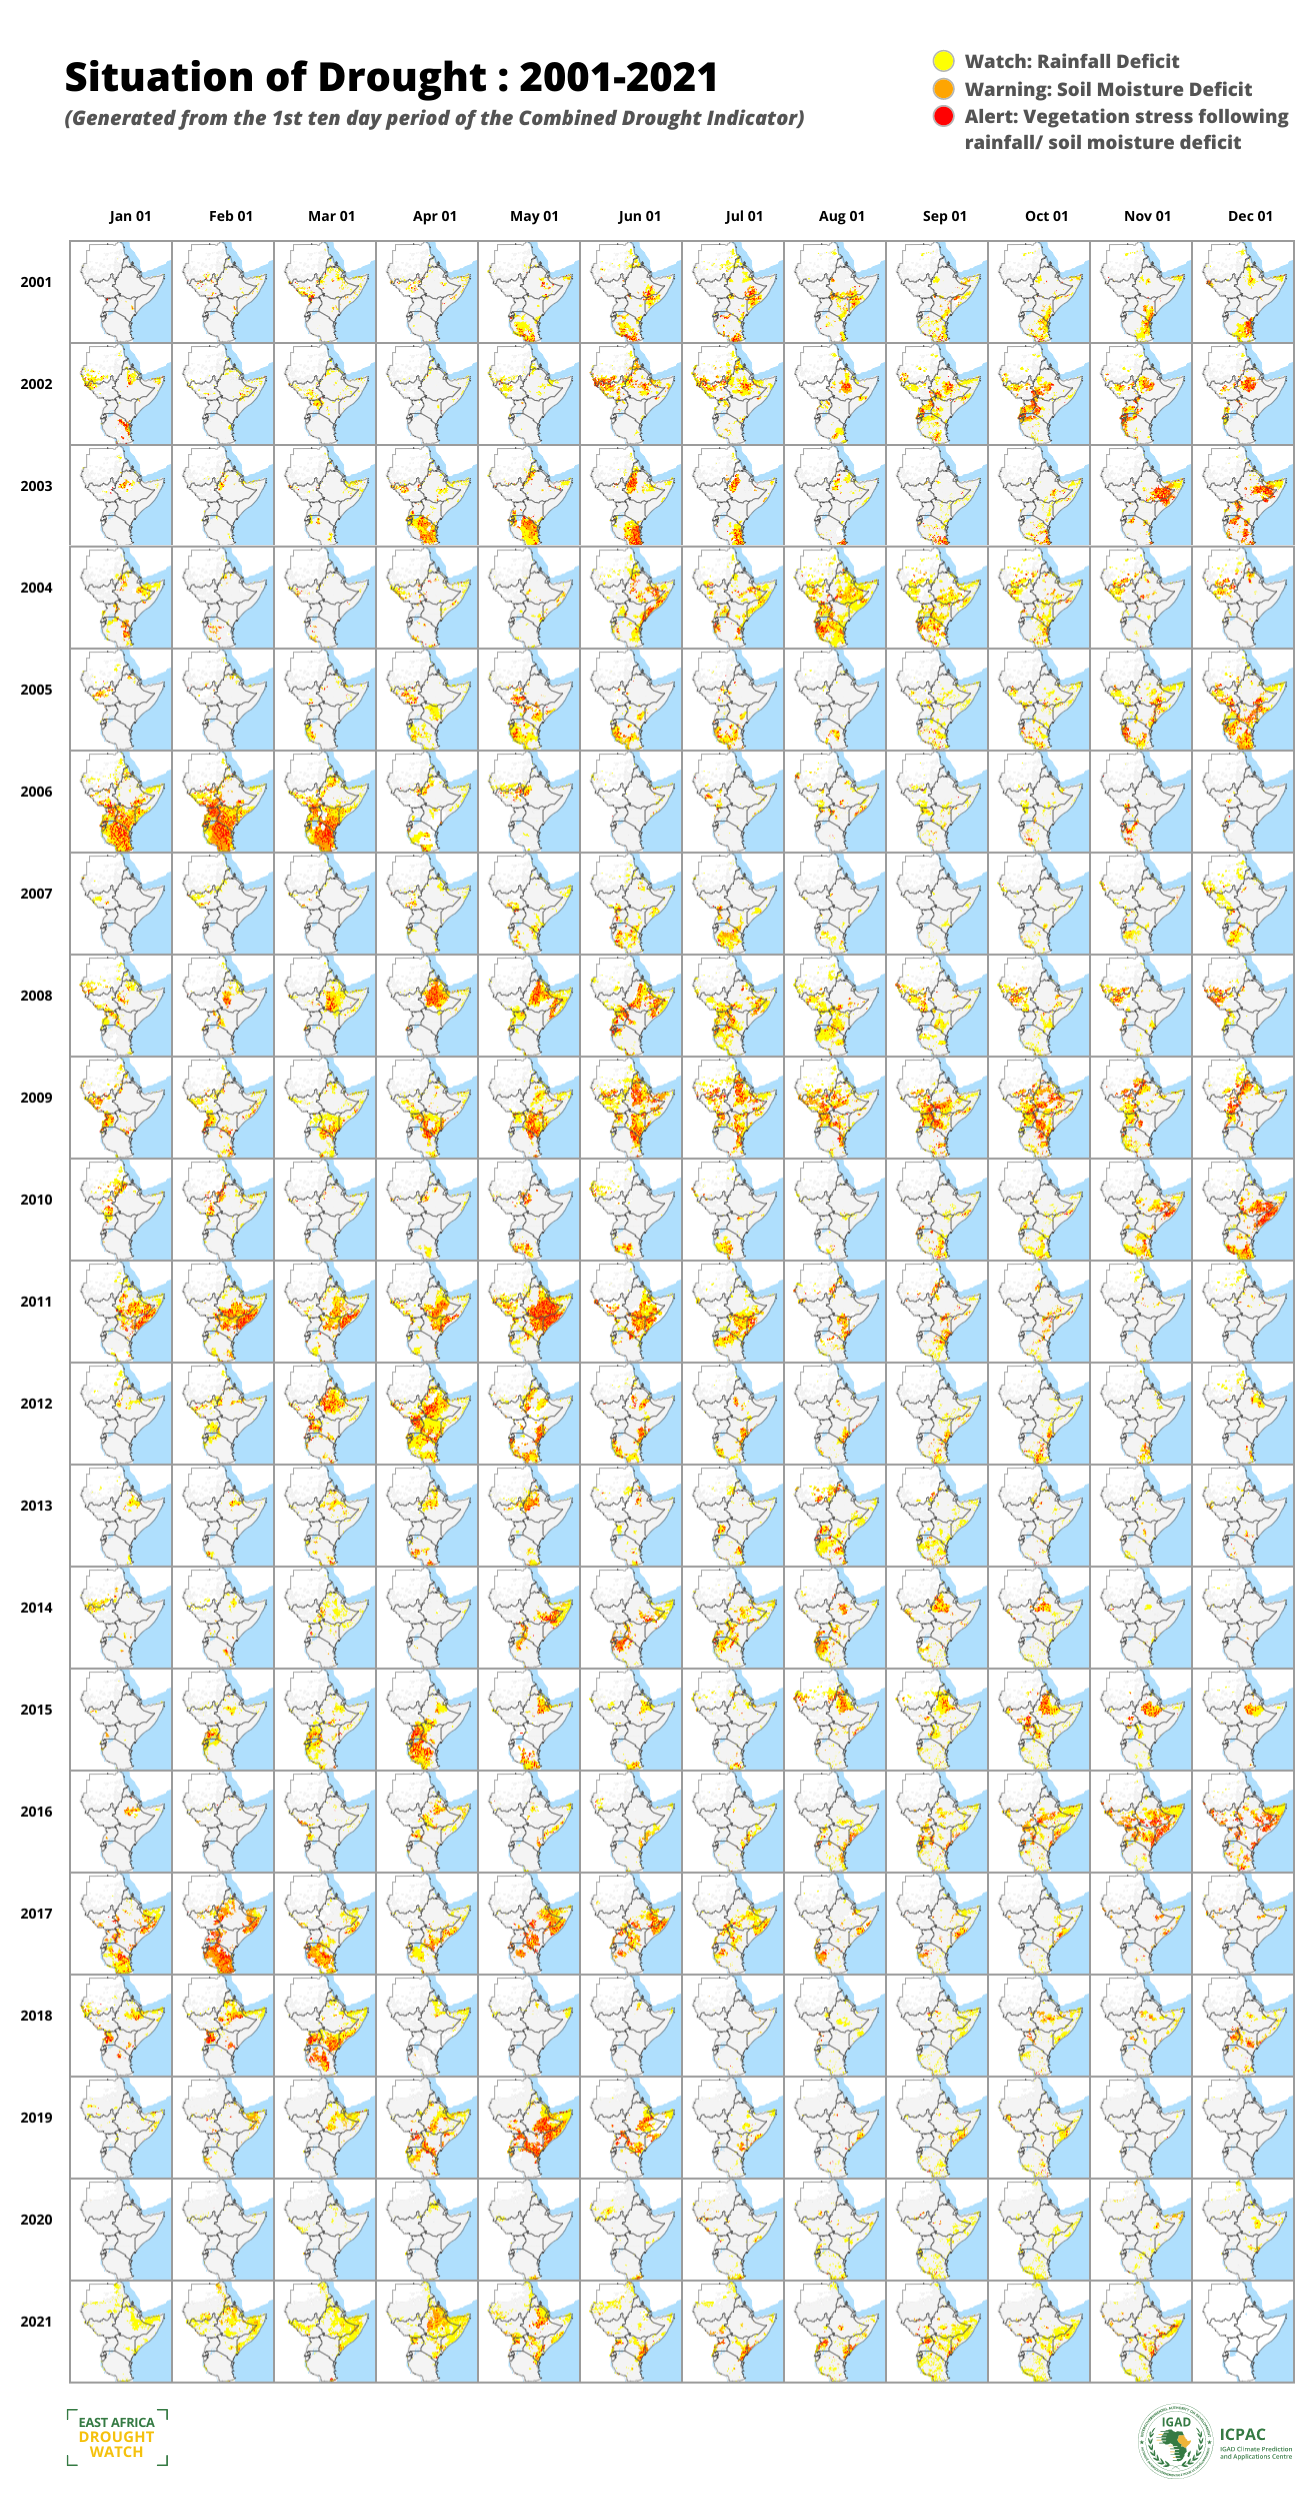
An assessment of the behaviour of the Combined Drought Indicator (CDI) for the main droughts between 2010 and 2021 demonstrated the CDI’s capability to discriminate the areas where the drought impacts were most severe.
The CDI was able to identify the areas suffering more severely the drought. . It also shows its potential as an early warning system, identifying the areas with potential to suffer drought effects (i.e. “Watch”), later on confirming this (i.e. “Warning”) and identifying the areas where the vegetation condition was being affected (i.e. “Alert”).
Strengths
Generally the assessment of drought is done using individual indicators that are based on meteorological or hydrological data, or remote sensing imagery. The development of a combined indicator that integrates meteorological, hydrological and remote sensing data, can help to reduce false alarms, which may arise for example in the case of vegetation-based indicators (e.g. FAPAR Anomaly) where a biomass reduction can be caused by factors other than a drought-induced water stress.
An integrated approach that provides a convergence of indicators and therefore evidence of drought, can also support policy-makers in effective risk management and decision-making.
Weaknesses
The satellite-derived FAPAR Anomaly indicator is based on reflected solar radiation, with wavelengths in the optical (i.e. visible and infrared wavelength) region of the electromagnetic spectrum, and is therefore not effective in the presence of clouds. Clouds are generally masked out before the indicator is computed. However, low clouds are not always detected, resulting in erroneous indicator values. This is a particular problem in northern European countries. One way to address this issue would be to use more than one indicator related to vegetation growth.
References
- De Roo, A., C. Wesseling, and W. van Deursen. 2000. Physically based river basin
modelling within a GIS: the LISFLOOD model, Hydrological Processes, 14, 1981–1992. https://doi.org/10.1002/1099-1085(20000815/30)14:11/12<1981::AIDHYP49>3.0.CO;2-F
- Edwards, D.C. and T.B. McKee. 1997. Characteristics of 20th Century Drought in
the United States at Multiple Time Scales. Climatology Report Number 97-2. Colorado State University, Fort Collins.
- Gobron N., B. Pinty, F. Mélin, M. Taberner, M.M. Verstraete, A. Belward, T. Lavergne,
and J.-L. Widlowski. 2005. The state of vegetation in Europe following the 2003 drought. International Journal of Remote Sensing, 26 (9): 2013-2020. https://doi.org/10.1080/01431160412331330293
- Ji, L. and A. Peters. 2003. Assessing vegetation response to drought in the northern
Great Plains using vegetation and drought indices. Remote Sens. Environ., 87: 85-98
- McKee, T.B., N.J. Doesken and J. Kleist. 1993. The relationship of drought frequency
and duration to time scale. In: Proceedings of the Eighth Conference on Applied Climatology, Anaheim, California, 17–22 January 1993. Boston, American Meteorological Society, 179–184.
- Laguardia, G. and S. Niemeyer. 2008. On the comparison between the LISFLOOD
modelled and the ERS/SCAT derived soil moisture estimates. Hydrology and Earth System Sciences, 12, 1339- 1351. https://www.hydrol-earth-systsci.net/12/1339/2008/
- Rossi, S. and S. Niemeyer. 2012. Drought Monitoring with estimates of the Fraction
of Absorbed Photosynthetically-active Radiation (fAPAR) derived from MERIS. In: Wardlow, B., M. Anderson, and J. Verdin (Editors). Remote Sensing for Drought: Innovative Monitoring Approaches. CRC Press, and Taylor and Francis, Boca Raton, FL, USA. Pages 95-116.
- Sepulcre-Canto, G., S. Horion, A. Singleton, H. Carrão, and J. Vogt. 2012.
Development of a Combined Drought Indicator to detect agricultural drought in Europe. Natural Hazards and Earth System Sciences, 12, 3519-3531.