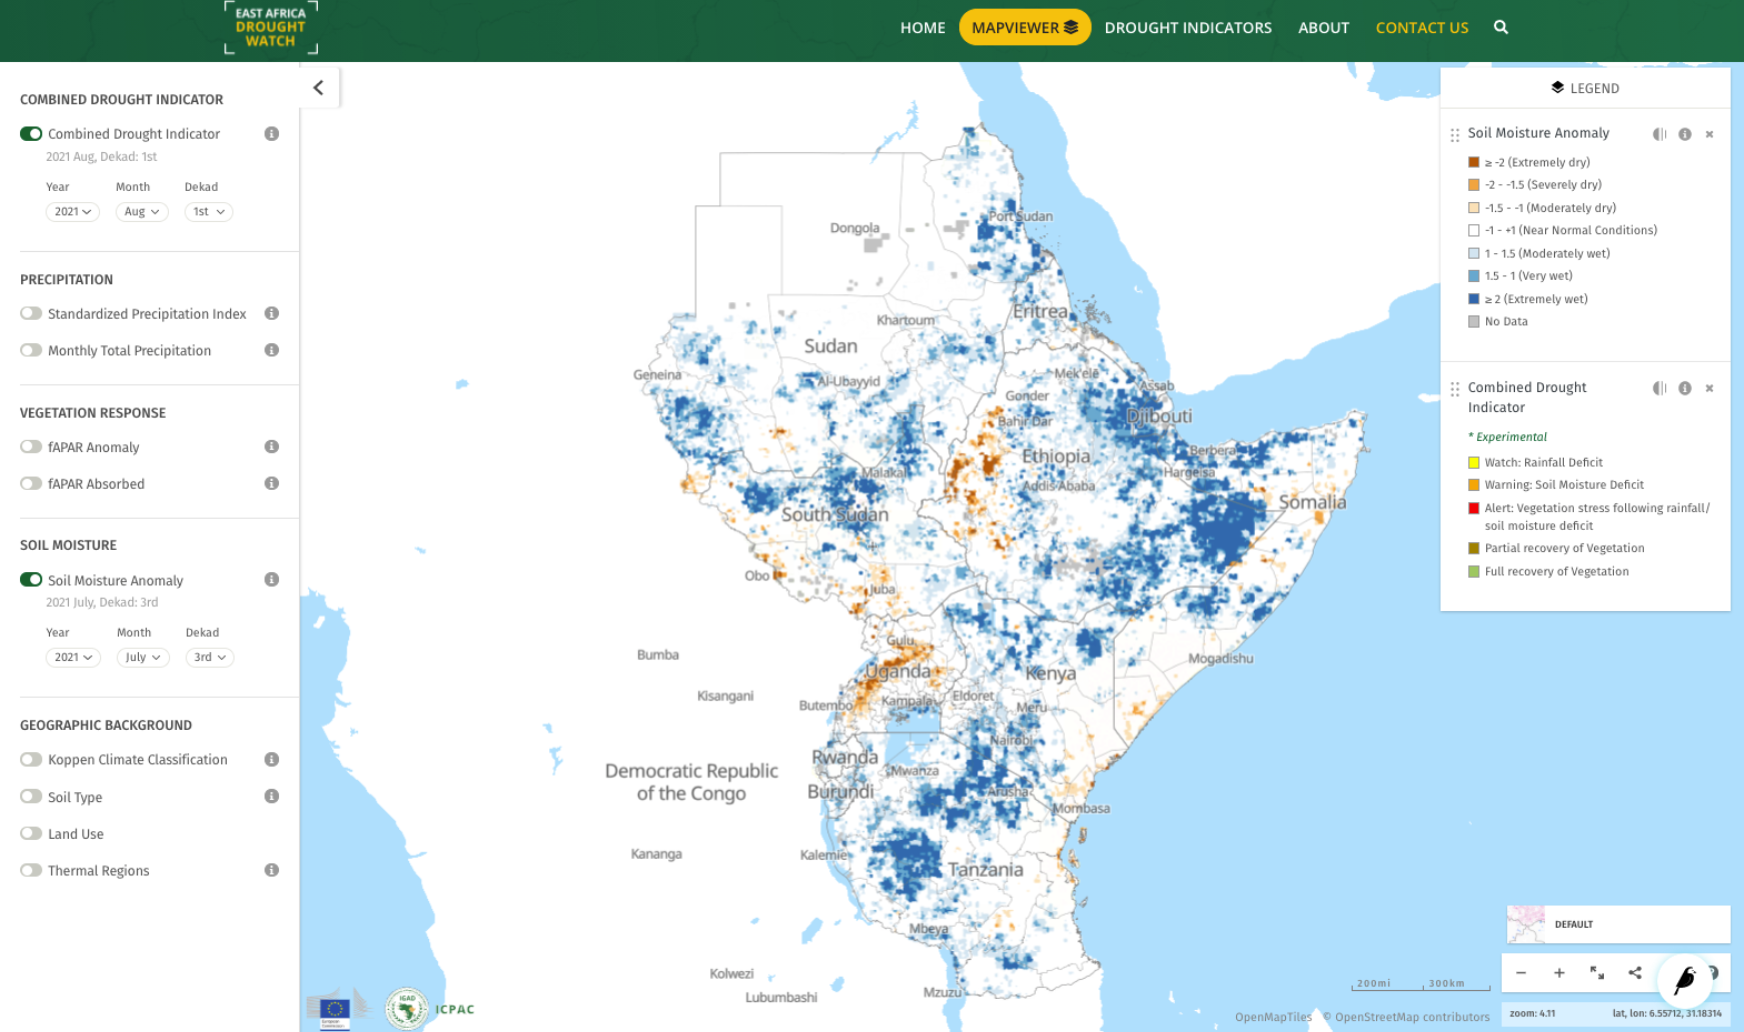
Soil Moisture Anomaly (SMA)
The Soil Moisture Anomaly is used in determining the start and duration of agricultural drought conditions, which arise when soil moisture availability to plants drops to such a level that it adversely affects crop yield, and hence, agricultural production
Overview
Soil moisture anomaly maps are computed on a 30-day moving window at a spatial resolution of 0.1 decimal degrees and updated every 10 days.
Moving windows have an ordinal reference:
1st window of month M goes from day 11 of month M-1 to day 10 of month M (e.g. 1st window of December goes from November 11 to December 10)
2nd window of month M goes from day 21 of month M-1 to day 20 of month M (e.g. 2nd window of June goes from May 21 to June 20)
3rd window of month M covers the whole month M, i.e. from day 1 to the end (e.g. 3rd window of March goes from March 1 to March 31)
The index is computed as a weighted average of three standardized variables: 1) LISFLOOD root zone soil moisture, 2) MODIS Land Surface Temperature, and 3) ESA CCI remote sensing skin soil moisture. All three variables are standardized on the same baseline period 2001-2016 and the weighting factors are computed as described in Cammalleri, C., Vogt, J. V., Bisselink, B., & de Roo, A. (2017). Comparing soil moisture anomalies from multiple independent sources over different regions across the globe. Hydrology and Earth System Sciences, 21(12), 6329.
The full ensemble of the three models is provided up to the second-to-last dekad, whereas the last dekad is a ‘first-guess’ estimate based only on LISFLOOD and MODIS LST data.
SMA is made available every ten days sourced from the Global Drought Observatory.